


We reduce customer workload by up to 70% while providing a one-stop solution for CO2 reduction.
Business DX ASUENE
Greenhouse Gas Reporting Software to Support Decarbonized Management

ASUENE is a cloud service for visualizing, reducing, and reporting CO2 emissions. Manage your Scope 1-3 emissions and product lifecycle assessment to accelerate actions to achieve net zero.

3 Key Features

Automatic visualization by simply scanning
- CO2 calculation by automatically capturing receipts, etc., using AI-OCR
- Accurate data entry with AI and ISO14064-3(1) certification
- Validity guaranteed by ISO14064-3 for all Scope 3 calculation methods
- CSV data upload, API integration, supply chain collaboration (registration request/registration status management)

Support by industry-experienced consultants
- In addition to system provision, expert consultants also assist with boundary setting and method selection

More efficient analysis and management operations
- Analysis by scope/facility, scenario analysis, benchmark analysis, etc.
- Creation support and automation generation of reports and responses for various standards (Japanese global warming law, CDP, RE100, SBTi, TCFD)
- Offset and execution support for carbon credits
| ※1 | ISO 14064-3:A standard that sets forth rules for validation and verification of greenhouse gas emissions calculations. |
| ※2 | CDP:Abbreviation for Carbon Disclosure Project. An international non-profit organization that promotes the disclosure of environmental information, including climate change initiatives, to companies and local governments. |
Sophisticated Interface
A simple and user-friendly UI/UX for unified management, from understanding of overall CO2 emissions to analysis of causes

Benefits
Companion support based on our extensive know-how and experience with more than 15,000 companies (as of August 2025)
<Before>

Wanting to work toward carbon neutrality but lacking an understanding of their own CO2 emissions.
<After>

Supporting decarbonization management with a wealth of case studies and achievements from over 15,000 companies.
Additionally, with the easy-to-use UI/UX, achieving one-stop management from CO2 emissions monitoring to root cause analysis is possible.
KDDI will propose reduction solutions combined with "ASUENE" through green consulting.
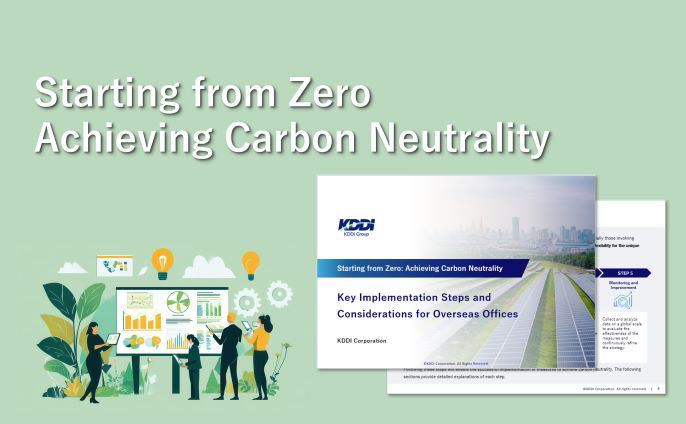
Supporting global companies in achieving carbon neutrality
<Before>

We want to become carbon neutral at our overseas offices and factories.
<After>

"ASUENE" is currently expanding internationally.
With a multilingual system, it supports global companies in achieving carbon neutrality, including those in Asia and the Americas.
They will also collaborate with our overseas subsidiaries to propose reduction measures based on calculated data of CO2 emissions.
Improving efficiency of information collection and calculation for visualization
<Before>

Lacking know-how in decarbonization tasks, companies face significant challenges in collecting information on the scope of calculation and appropriate emission factors. This process is time-consuming and makes it difficult to reflect in the latest data.
In addition, calculating up to Scope 3 highlights the limitations of Excel-based management, raising concerns about errors caused by human factors.
<After>

Using a system powered by AI-OCR, emissions are accurately calculated by uploading invoices and visualized on a dashboard.
Since the supply chain data required for Scope 3 calculations can also be requested and managed on the cloud, the necessary tasks for visualization can be made more efficient.
| * | Based on research by Asuene Inc.: Calculated from actual working hours in user interviews for 100 tasks per month |
Visualized data is analyzed, reported, and used to develop reduction strategies
<Before>

Unable to utilize data and develop reduction strategies after visualization.
<After>

Because the accuracy of emissions calculations is ensured by ISO 14063-3, the visualized data can be used for reporting to international assessment organizations such as CDP.
Please consult a KDDI consultant.
- Achieving Carbon Neutrality
We assist in realizing carbon neutrality in your business, from visualizing and analyzing CO2 emissions to exploring and implementing reduction strategies.

Related Knowledge Articles

Related whitepaper
What is the best solution for your problem?
Please consult a KDDI consultant.